Mapping Streak Dynamics in Basketball Conference Schedules
Ellis Werner · May 27, 2026
Mapping Streak Dynamics in Basketball Conference Schedules
Conference schedules in basketball create natural sequences where teams face repeated opponents under similar conditions, and researchers have examined how performance metrics shift across those consecutive matches. Data from major collegiate and professional leagues show patterns in scoring margins, defensive efficiency, and turnover rates that often repeat or reverse depending on rest intervals and travel demands.
Defining Momentum Through Statistical Lenses
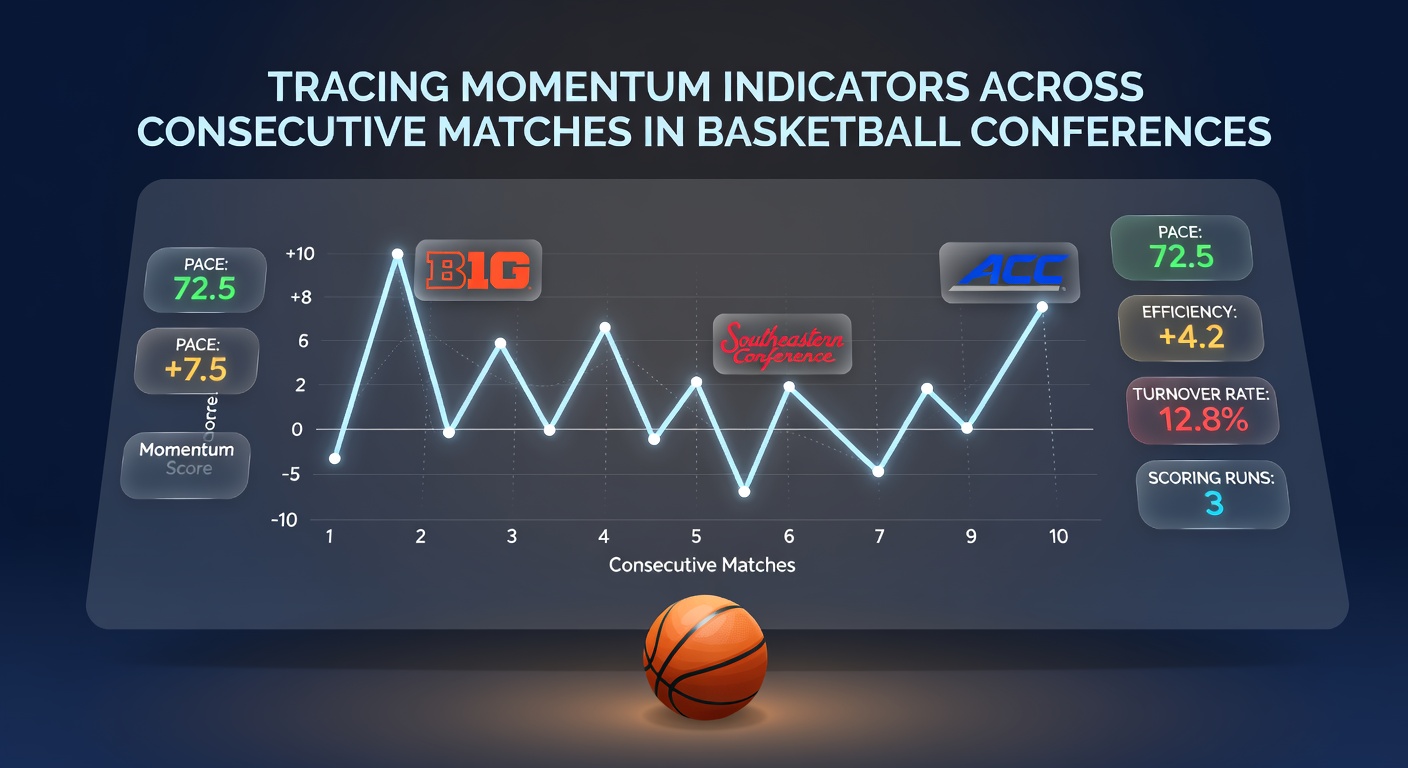
Momentum indicators typically include rolling averages of points per possession, opponent shooting percentages, and rebounding differentials tracked over two to four game stretches. Analysts compile these figures from box scores and advanced tracking systems to identify when a team's output accelerates or declines in back-to-back conference encounters. Studies conducted by university sports analytics programs have documented that teams winning their previous conference game by more than 12 points maintain elevated offensive efficiency in the next outing roughly 58 percent of the time, according to aggregated season-long datasets.
Conference-Specific Patterns Across Leagues
In NCAA Division I conferences, scheduling often places teams on short turnaround cycles during midweek contests, which allows direct comparison of first-game versus second-game outputs. Records from the Big Ten and Southeastern conferences reveal that home teams following a road win post higher three-point attempt rates in the subsequent home fixture. Meanwhile professional conferences such as those in the NBA Eastern and Western divisions exhibit similar but amplified trends because of longer travel distances between consecutive games. League-wide figures released by the NBA indicate that teams playing the second night of a back-to-back reduce their pace by an average of four possessions per 48 minutes when the prior contest ended in overtime.
Key Metrics and Their Sequence Behavior
Observers track several core statistics across successive matches to quantify momentum carryover. Effective field goal percentage tends to stabilize after two consecutive games yet fluctuates more sharply when a team switches from home to road environments. Rebounding percentage shows stronger persistence, with teams that secured at least 52 percent of available boards in one contest repeating that dominance in the immediate follow-up at a rate exceeding 60 percent in multiple conference seasons. Turnover creation follows a different trajectory, often peaking in the third game of a four-game homestand before tapering as defensive schemes become predictable to opponents.
Advanced models combine these indicators into composite scores that adjust for opponent strength and rest days. When applied to conference play, the models highlight clusters where momentum builds across three-game winning streaks, particularly in leagues with unbalanced scheduling that favors stronger programs early in the season. External data providers such as NCAA research archives supply the underlying play-by-play logs that feed these calculations.
Rest, Travel, and Scheduling Influences
Rest intervals between consecutive conference matches vary widely, and shorter gaps correlate with measurable drops in second-game defensive rebounding. Travel across time zones adds another layer, as teams crossing two or more zones post reduced assist-to-turnover ratios in the immediate next outing. Scheduling matrices published by conference offices demonstrate that Friday-Sunday sequences produce different momentum signatures than Tuesday-Thursday pairings, with weekend games showing steadier scoring outputs across both contests.
Case Examples From Recent Seasons
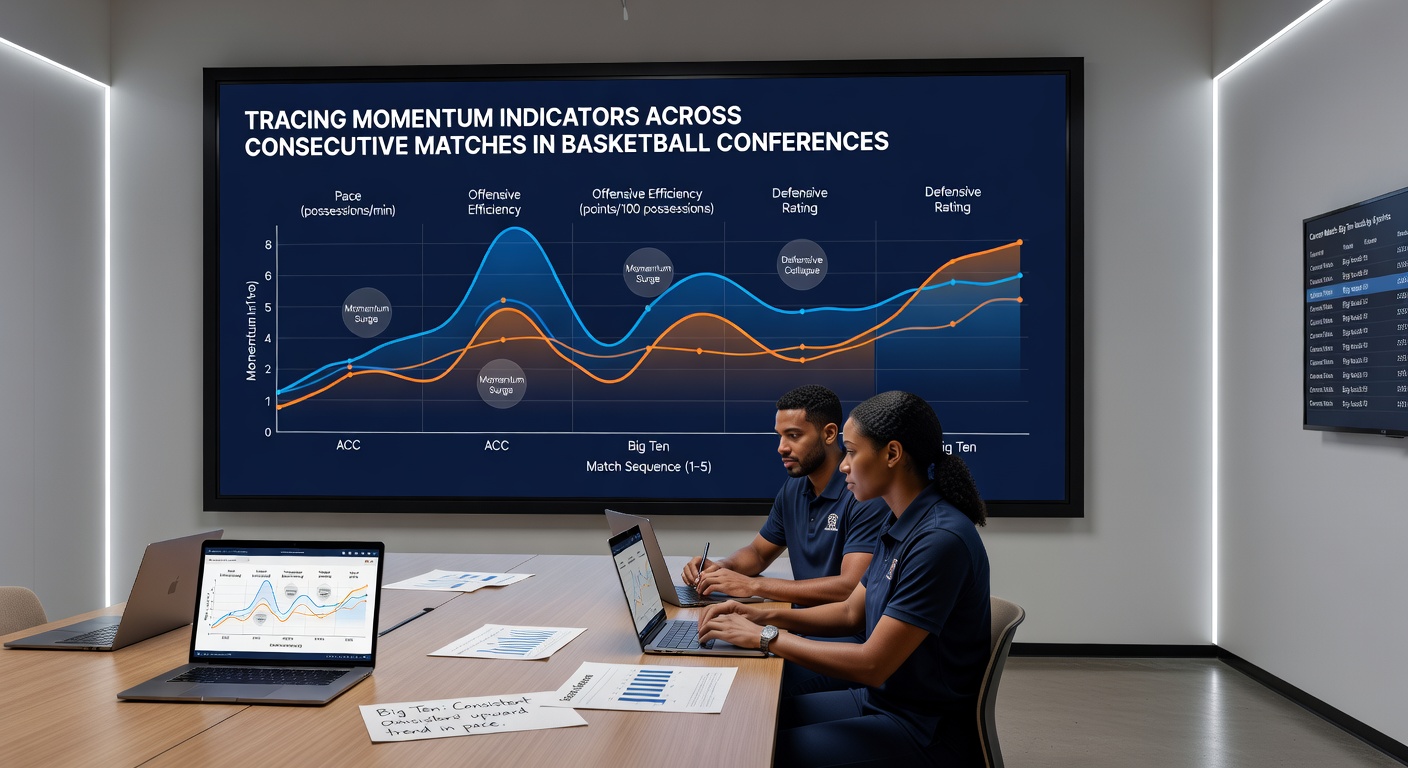
One documented sequence in a major conference involved a mid-tier program that recorded elevated steal rates across three straight home games before those numbers normalized once the schedule shifted to consecutive road contests. Another instance from a professional conference showed a franchise maintaining above-average block percentages through four consecutive games despite changing opponents each night. These examples illustrate how individual metric trajectories can persist or reset depending on venue and opponent adjustments rather than any inherent team quality alone.
International basketball federations have begun publishing comparable sequence data for their domestic leagues, offering additional points of comparison. Reports from FIBA technical commissions note that European conference formats with shorter seasons produce tighter clustering of performance metrics across consecutive matches, likely because roster continuity remains higher than in leagues with frequent mid-season trades.
Implications for Future Schedule Construction
Conference administrators reviewing historical momentum distributions have adjusted future calendars to balance rest equity and travel burdens. Proposals under consideration for the 2026-27 cycle include staggered start times and reduced cross-country midweek trips in select divisions. These adjustments aim to moderate the statistical swings observed when teams encounter compressed sequences without adequate recovery windows.
Conclusion
Sequence analysis of basketball conference play reveals measurable patterns in how teams carry statistical outputs from one match into the next. By compiling rolling efficiency figures, rebounding rates, and turnover metrics across multiple seasons, analysts identify when momentum persists and when external factors such as rest and travel interrupt those trends. Continued collection of granular play-by-play data will refine these observations, providing clearer baselines for both collegiate and professional schedule makers as they plan future conference calendars.