Analyzing Referee Tendencies for Card and Penalty Markets in Domestic Cup Competitions
Iris Otto · Jul 17, 2026
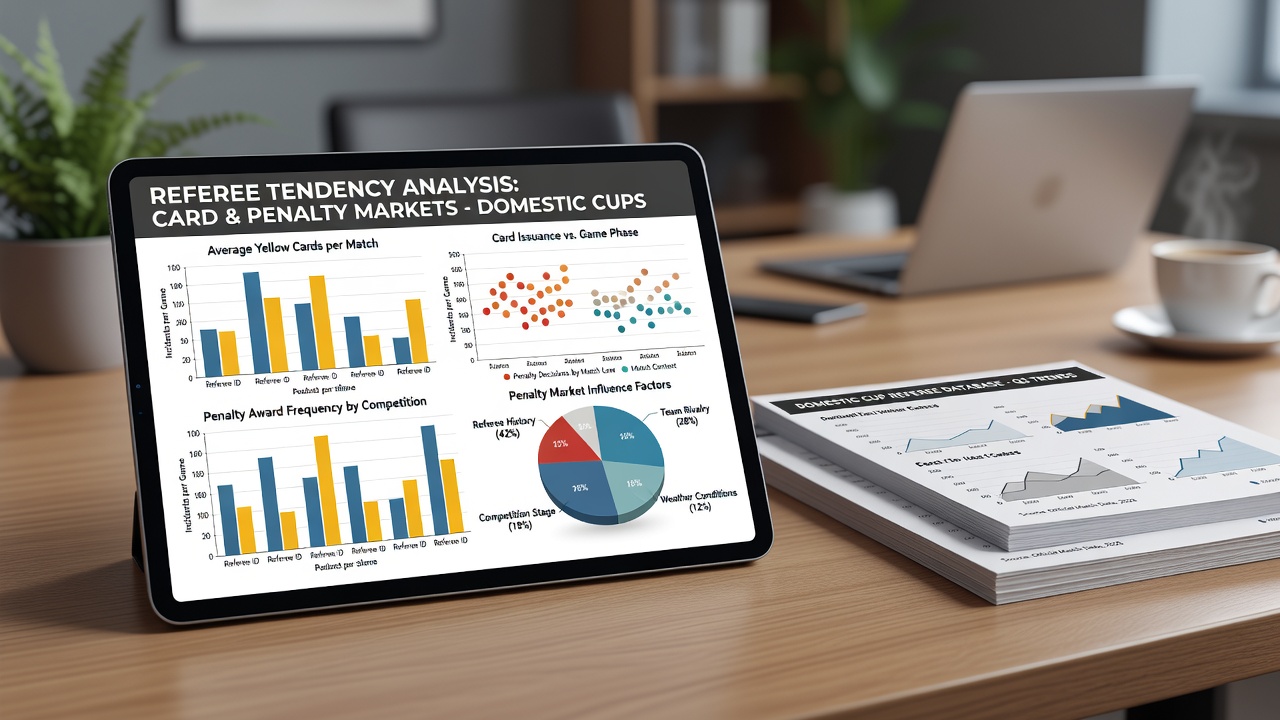
Analyzing Referee Tendencies for Card and Penalty Markets in Domestic Cup Competitions
Domestic cup competitions create unique environments where referee decisions carry heightened weight because single matches determine progression rather than season-long points accumulation. Analysts track patterns in card issuance and penalty awards by compiling data across multiple seasons of knockout ties, and these datasets reveal consistent variations tied to match context, venue, and individual official profiles. Referee tendencies emerge most clearly when researchers compare cup fixtures against regular league games. Knockout formats often feature elevated physical intensity in the opening stages, yet the same officials apply stricter thresholds for fouls once extra time or penalty shootouts approach. Data from recent campaigns shows that certain referees average 0.8 more yellow cards per game in cup ties than in their league assignments, particularly when teams from different leagues meet.Collecting and Structuring Referee Data
Observers build comprehensive profiles by logging every card, penalty, and second-yellow dismissal across domestic cups such as the FA Cup, DFB-Pokal, and Copa del Rey. They segment statistics by referee age group, experience level, and geographic origin to identify clusters. For instance, officials who primarily work lower-division matches tend to award penalties at a lower rate in cup ties involving top-flight sides, whereas those with extensive international exposure show more balanced distributions.
Researchers cross-reference these figures with match reports and video reviews to account for situational factors like crowd density and weather conditions. The resulting models weight recent performances more heavily because refereeing styles evolve, and adjustments become visible within a single season. In July 2026, updated tracking systems introduced by several national federations began supplying granular timestamps for each incident, allowing analysts to measure how quickly cards follow repeated fouls in cup environments.
Card Markets and Style Indicators
Card markets respond directly to referee-specific baselines. Some officials maintain low card counts early in matches but increase frequency sharply after the 60-minute mark when fatigue amplifies challenges. Others issue early cautions to establish control, producing totals that exceed league averages even in relatively clean encounters. Market participants monitor these patterns through rolling averages calculated over the previous 20 to 30 cup appointments.
One notable case involved a referee who officiated six domestic cup matches during the 2024-25 season and averaged 5.8 yellow cards per game, compared with 3.9 in league fixtures. Subsequent analysis attributed the difference to stricter interpretation of shirt-pulling in set-piece situations, a tendency confirmed across multiple video reviews. Such findings allow models to adjust expected card totals based on the assigned official rather than applying generic competition averages.

Penalty Award Patterns
Penalty markets require separate tracking because decisions cluster around specific zones of the penalty area and types of contact. Data indicates that referees with fewer than five years of top-division experience award penalties at rates 12 percent below the competition mean in cup ties, while veterans maintain closer alignment with league figures. Location also matters: home teams receive slightly higher award rates in domestic cups than in league matches, though the margin narrows when neutral-venue semifinals and finals are isolated.
Analysts further refine projections by examining historical interactions between particular referees and teams. Certain officials show elevated penalty rates when officiating sides known for high pressing, because their movement patterns create more boundary-line challenges. These correlations strengthen when matches extend into extra time, where fatigue-related contact increases.
Applying Analysis in Practice
Practitioners combine referee profiles with team style metrics to generate expected ranges for cards and penalties in upcoming cup fixtures. They incorporate travel distance and fixture congestion as additional variables because these factors correlate with increased physical duels. Models update continuously as new matches conclude, ensuring projections reflect the latest tendencies rather than outdated season aggregates.
National associations in Australia and Canada have published anonymized referee performance summaries that researchers use to benchmark domestic cup data against other competitions. These reports highlight how officials adapt decision thresholds when moving between league and cup environments, providing external calibration points for analysis frameworks.
Conclusion
Referee tendency analysis for card and penalty markets in domestic cup competitions rests on systematic data collection, situational segmentation, and ongoing model refinement. By isolating variables such as match phase, official experience, and fixture context, analysts produce projections that account for the distinct dynamics of knockout football. Continued improvements in tracking technology, including those implemented around July 2026, support increasingly precise differentiation between league and cup behavior, allowing patterns to be identified and applied with greater consistency across competitions.